
English
Keep the rows and columns where they belong
A table is an argument about position: this figure belongs to that year and that country, and the moment a column slips by one the whole thing is worse than useless. Real tables make it harder — headers stacked two deep, a heading that spans six rows, cells left blank on purpose, dotted leaders, footnote daggers and a total rule near the bottom. Evidano reads the grid as a grid and tells you where a cell was empty rather than quietly closing the gap.
Sample pages
Evidano Transcription
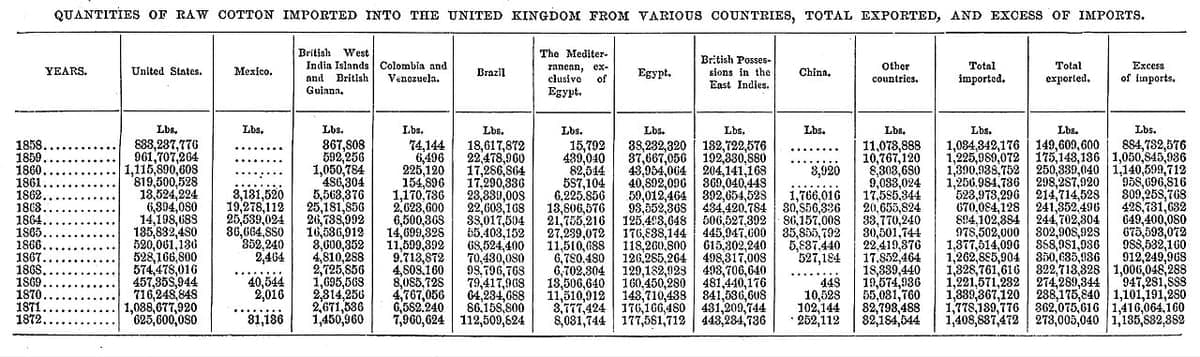
The whole table, from the Wikisource transcription of this image. The wiki table has been rendered here as one line per row with columns separated by a vertical bar; the rows of dots are the source’s own marks for no recorded quantity, and the column order is that of the header line.
QUANTITIES OF RAW COTTON IMPORTED INTO THE UNITED KINGDOM FROM VARIOUS COUNTRIES, TOTAL EXPORTED, AND EXCESS OF IMPORTS.
YEARS. | United States. | Mexico. | British West India Islands and British Guiana. | Colombia and Venezuela. | Brazil | The Mediterranean, exclusive of Egypt. | Egypt. | British Possessions in the East Indies. | China. | Other countries. | Total imported. | Total exported. | Excess of imports.
(all quantities in Lbs.)
1858 | 833,237,776 | ........ | 367,808 | 74,144 | 18,617,872 | 15,792 | 38,232,320 | 132,722,576 | ........ | 11,073,888 | 1,034,342,176 | 149,609,600 | 884,732,576
1859 | 961,707,264 | ........ | 592,256 | 6,496 | 22,478,960 | 439,040 | 37,667,056 | 192,330,880 | ........ | 10,767,120 | 1,225,989,072 | 175,143,136 | 1,050,845,936
1860 | 1,115,890,608 | ........ | 1,050,784 | 225,120 | 17,286,864 | 82,544 | 43,954,064 | 204,141,168 | 3,920 | 8,303,680 | 1,390,938,752 | 250,339,040 | 1,140,599,712
1861 | 819,500,528 | ........ | 486,304 | 154,896 | 17,290,336 | 587,104 | 40,892,096 | 369,040,448 | ........ | 9,033,024 | 1,256,984,736 | 298,287,920 | 958,696,816
1862 | 13,524,224 | 3,131,520 | 5,563,376 | 1,170,736 | 23,339,008 | 6,225,856 | 59,012,464 | 392,654,528 | 1,766,016 | 17,585,344 | 523,973,296 | 214,714,528 | 309,258,768
1863 | 6,394,080 | 19,278,112 | 25,181,856 | 2,623,600 | 22,603,168 | 13,806,576 | 93,552,368 | 434,420,784 | 30,856,336 | 20,655,824 | 670,084,128 | 241,352,496 | 428,731,632
1864 | 14,198,688 | 25,539,024 | 26,738,992 | 6,500,368 | 38,017,504 | 21,755,216 | 125,493,648 | 506,527,392 | 86,157,008 | 33,770,240 | 894,102,384 | 244,702,304 | 649,400,080
1865 | 135,832,480 | 36,664,880 | 16,536,912 | 14,699,328 | 55,403,152 | 27,239,072 | 176,838,144 | 445,947,600 | 35,855,792 | 30,501,744 | 978,502,000 | 302,908,928 | 675,593,072
1866 | 520,061,136 | 352,240 | 3,600,352 | 11,599,392 | 68,524,400 | 11,510,688 | 118,260,800 | 615,302,240 | 5,837,440 | 22,419,376 | 1,377,514,096 | 388,981,936 | 988,532,160
1867 | 528,166,800 | 2,464 | 4,810,288 | 9,713,872 | 70,430,080 | 6,780,480 | 126,285,264 | 498,317,008 | 527,184 | 17,852,464 | 1,262,885,904 | 350,635,936 | 912,249,968
1868 | 574,478,016 | ........ | 2,725,856 | 4,808,160 | 98,796,768 | 6,702,304 | 129,182,928 | 493,706,640 | ........ | 18,339,440 | 1,328,761,616 | 322,713,328 | 1,006,048,288
1869 | 457,358,944 | 40,544 | 1,695,568 | 8,085,728 | 79,417,968 | 13,506,640 | 160,450,280 | 481,440,176 | 448 | 19,574,936 | 1,221,571,232 | 274,289,344 | 947,281,888
1870 | 716,248,848 | 2,016 | 2,314,256 | 4,767,056 | 64,234,688 | 11,510,912 | 143,710,438 | 341,536,608 | 10,528 | 55,031,760 | 1,339,367,120 | 238,175,840 | 1,101,191,280
1871 | 1,088,677,920 | ........ | 2,671,536 | 6,582,240 | 86,158,800 | 3,777,424 | 176,166,480 | 431,209,744 | 102,144 | 32,793,488 | 1,778,139,776 | 362,075,616 | 1,416,064,160
1872 | 625,600,080 | 31,136 | 1,450,960 | 7,960,624 | 112,509,824 | 8,031,744 | 177,581,712 | 443,234,736 | 252,112 | 32,184,544 | 1,408,837,472 | 273,005,040 | 1,135,832,382
Source: The American Cyclopædia (1879), “Cotton”, table of United Kingdom imports and exports, via Wikisource (Public domain).
US Bureau of Alcohol, Tobacco and Firearms · Source · Public domain
Evidano Transcription
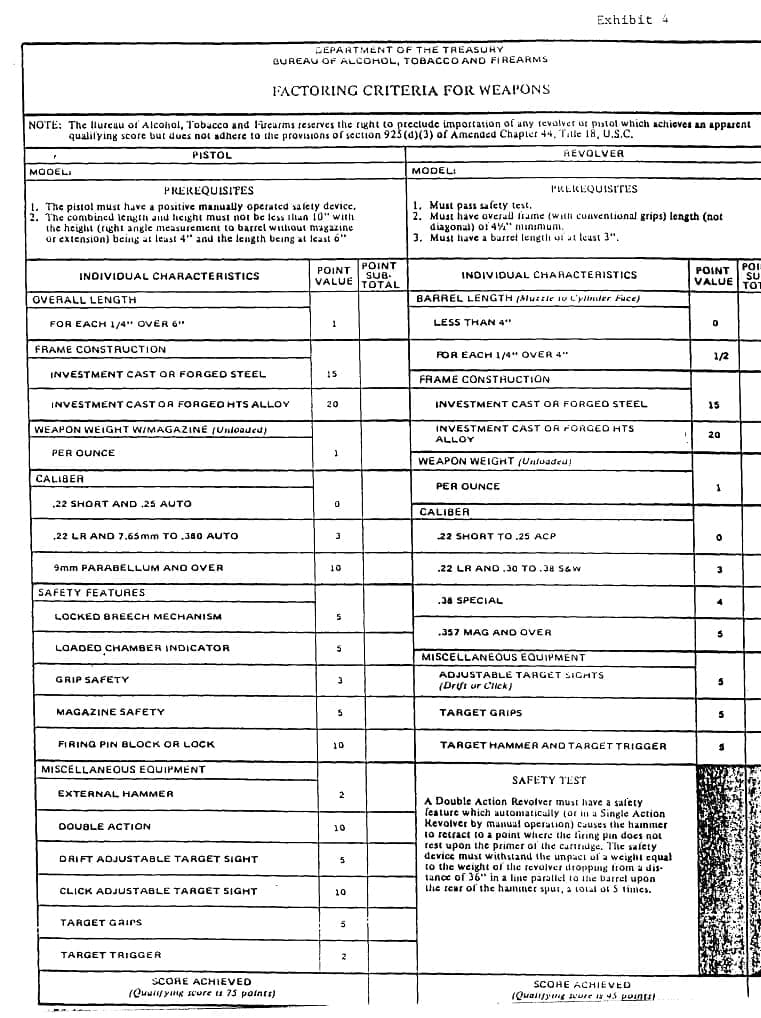
Exhibit 4
DEPARTMENT OF THE TREASURY
BUREAU OF ALCOHOL, TOBACCO AND FIREARMS
FACTORING CRITERIA FOR WEAPONS
| NOTE: The Bureau of Alcohol, Tobacco and Firearms reserves the right to preclude importation of any revolver or pistol which achieves an apparent qualifying score but does not adhere to the provisions of section 925(d)(3) of Amended Chapter 44, Title 18, U.S.C. | |||||
|---|---|---|---|---|---|
| PISTOL | REVOLVER | ||||
| MODEL: | MODEL: | ||||
| PREREQUISITES 1. The pistol must have a positive manually operated safety device. 2. The combined length and height must not be less than 10" with the height (right angle measurement to barrel without magazine or extension) being at least 4" and the length being at least 6" | PREREQUISITES 1. Must pass safety test. 2. Must have overall frame (with conventional grips) length (not diagonal) of 4 1/2" minimum. 3. Must have a barrel length of at least 3". | ||||
| INDIVIDUAL CHARACTERISTICS | POINT VALUE | POINT SUB-TOTAL | INDIVIDUAL CHARACTERISTICS | POINT VALUE | POINT SUB-TOTAL |
| OVERALL LENGTH | BARREL LENGTH (Muzzle to Cylinder Face) | ||||
| FOR EACH 1/4" OVER 6" | 1 | LESS THAN 4" | 0 | ||
| FRAME CONSTRUCTION | FOR EACH 1/4" OVER 4" | 1/2 | |||
| INVESTMENT CAST OR FORGED STEEL | 15 | FRAME CONSTRUCTION | |||
| INVESTMENT CAST OR FORGED HTS ALLOY | 20 | INVESTMENT CAST OR FORGED STEEL | 15 | ||
| WEAPON WEIGHT W/MAGAZINE (Unloaded) | INVESTMENT CAST OR FORGED HTS ALLOY | 20 | |||
| PER OUNCE | 1 | WEAPON WEIGHT (Unloaded) | |||
| CALIBER | PER OUNCE | 1 | |||
| .22 SHORT AND .25 AUTO | 0 | CALIBER | |||
| .22 LR AND 7.65mm TO .380 AUTO | 3 | .22 SHORT TO .25 ACP | 0 | ||
| 9mm PARABELLUM AND OVER | 10 | .22 LR AND .30 TO .38 S&W | 3 | ||
| SAFETY FEATURES | .38 SPECIAL | 4 | |||
| LOCKED BREECH MECHANISM | 5 | .357 MAG AND OVER | 5 | ||
| LOADED CHAMBER INDICATOR | 5 | MISCELLANEOUS EQUIPMENT | |||
| GRIP SAFETY | 3 | ADJUSTABLE TARGET SIGHTS (Drift or Click) | 5 | ||
| MAGAZINE SAFETY | 5 | TARGET GRIPS | 5 | ||
| FIRING PIN BLOCK OR LOCK | 10 | TARGET HAMMER AND TARGET TRIGGER | 5 | ||
| MISCELLANEOUS EQUIPMENT | SAFETY TEST A Double Action Revolver must have a safety feature which automatically (or in a Single Action Revolver by manual operation) causes the hammer to retract to a point where the firing pin does not rest upon the primer of the cartridge. The safety device must withstand the impact of a weight equal to the weight of the revolver dropping from a distance of 36" in a line parallel to the barrel upon the rear of the hammer spur, a total of 5 times. | ||||
| EXTERNAL HAMMER | 2 | ||||
| DOUBLE ACTION | 10 | ||||
| DRIFT ADJUSTABLE TARGET SIGHT | 5 | ||||
| CLICK ADJUSTABLE TARGET SIGHT | 10 | ||||
| TARGET GRIPS | 5 | ||||
| TARGET TRIGGER | 2 | ||||
| SCORE ACHIEVED (Qualifying score is 75 points) | SCORE ACHIEVED (Qualifying score is 45 points) |
Generated by Evidano’s advanced model; not yet checked against a published edition.
NASA Johnson Space Center, 2002 · Source · Public domain
Evidano Transcription
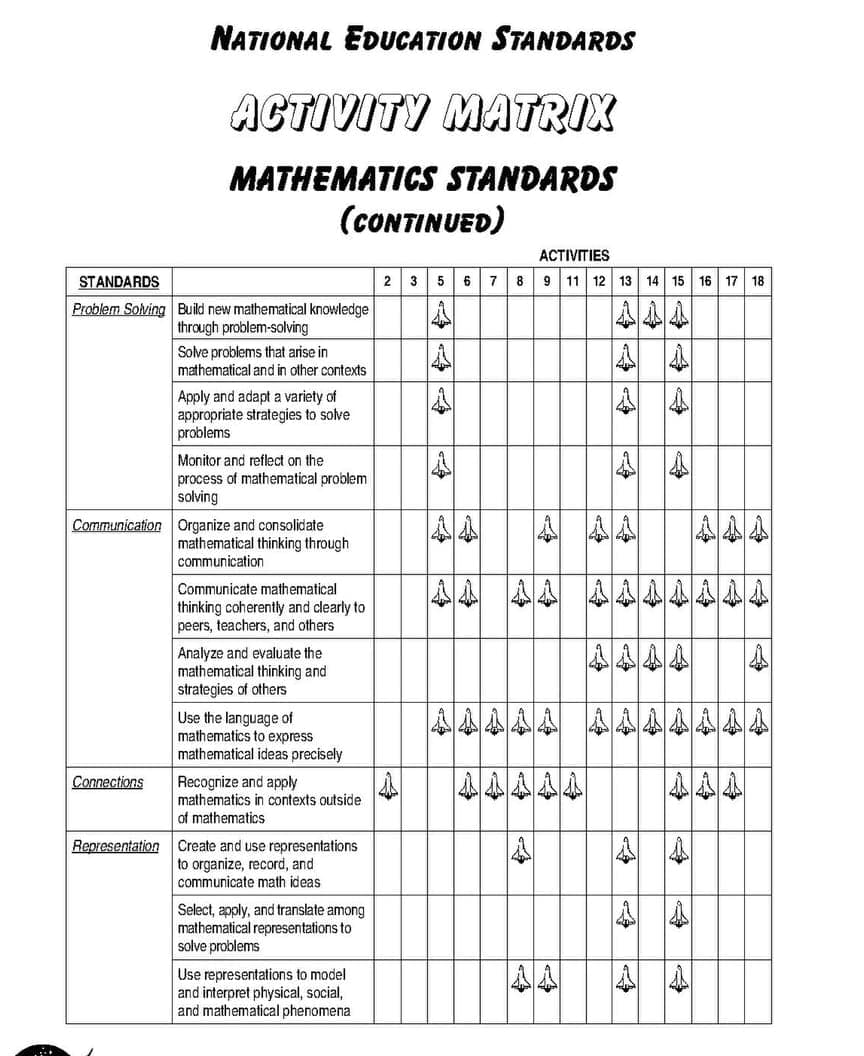
NATIONAL EDUCATION STANDARDS
ACTIVITY MATRIX
MATHEMATICS STANDARDS
(CONTINUED)
ACTIVITIES
| STANDARDS | 2 | 3 | 5 | 6 | 7 | 8 | 9 | 11 | 12 | 13 | 14 | 15 | 16 | 17 | 18 | |
|---|---|---|---|---|---|---|---|---|---|---|---|---|---|---|---|---|
| Problem Solving | Build new mathematical knowledge through problem-solving | X | X | X | X | |||||||||||
| Solve problems that arise in mathematical and in other contexts | X | X | X | |||||||||||||
| Apply and adapt a variety of appropriate strategies to solve problems | X | X | X | |||||||||||||
| Monitor and reflect on the process of mathematical problem solving | X | X | X | |||||||||||||
| Communication | Organize and consolidate mathematical thinking through communication | X | X | X | X | X | X | X | X | |||||||
| Communicate mathematical thinking coherently and clearly to peers, teachers, and others | X | X | X | X | X | X | X | X | X | X | X | |||||
| Analyze and evaluate the mathematical thinking and strategies of others | X | X | X | X | X | |||||||||||
| Use the language of mathematics to express mathematical ideas precisely | X | X | X | X | X | X | X | X | X | X | X | X | ||||
| Connections | Recognize and apply mathematics in contexts outside of mathematics | X | X | X | X | X | X | X | X | X | ||||||
| Representation | Create and use representations to organize, record, and communicate math ideas | X | X | X | ||||||||||||
| Select, apply, and translate among mathematical representations to solve problems | X | X | ||||||||||||||
| Use representations to model and interpret physical, social, and mathematical phenomena | X | X | X | X |
Generated by Evidano’s advanced model; not yet checked against a published edition.
Source · CC BY-SA 2.0 · Photograph by Aubrey Morandarte
Evidano Transcription
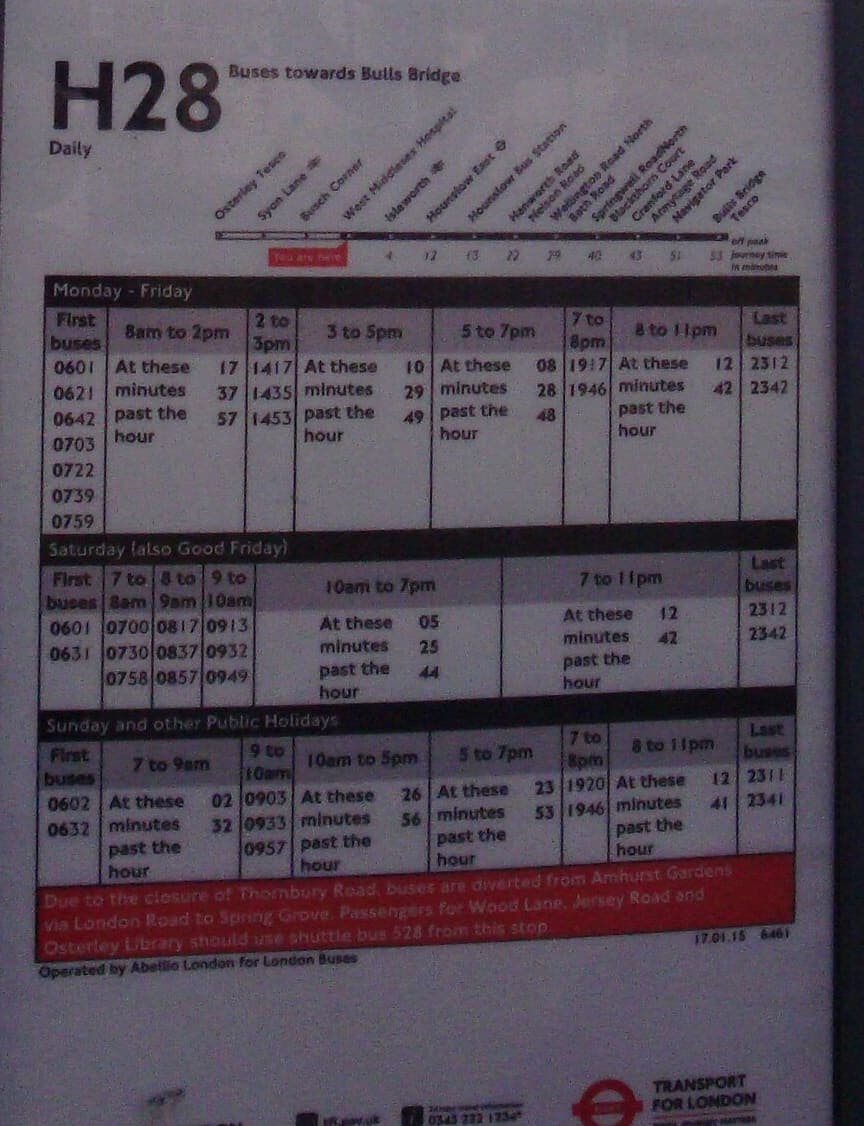
H28 Buses towards Bulls Bridge
Daily
Osterley Tesco
Syon Lane
Busch Corner
West Middlesex Hospital
Isleworth
Hounslow East
Hounslow Bus Station
Hanworth Road Nelson Road
Wellington Road North Bath Road
Springwell Road North Blackthorn Court
Cranford Lane Armytage Road
Navigator Park
Bulls Bridge Tesco
You are here 4 12 13 22 29 40 43 51 53 off peak journey time in minutes
Monday - Friday
| First buses | 8am to 2pm | 2 to 3pm | 3 to 5pm | 5 to 7pm | 7 to 8pm | 8 to 11pm | Last buses |
|---|---|---|---|---|---|---|---|
| 0601 | At these 17 | 1417 | At these 10 | At these 08 | 1917 | At these 12 | 2312 |
| 0621 | minutes 37 | 1435 | minutes 29 | minutes 28 | 1946 | minutes 42 | 2342 |
| 0642 | past the 57 | 1453 | past the 49 | past the 48 | past the | ||
| 0703 | hour | hour | hour | hour | |||
| 0722 | |||||||
| 0739 | |||||||
| 0759 |
Saturday (also Good Friday)
| First buses | 7 to 8am | 8 to 9am | 9 to 10am | 10am to 7pm | 7 to 11pm | Last buses |
|---|---|---|---|---|---|---|
| 0601 | 0700 | 0817 | 0913 | At these 05 | At these 12 | 2312 |
| 0631 | 0730 | 0837 | 0932 | minutes 25 | minutes 42 | 2342 |
| 0758 | 0857 | 0949 | past the 44 | past the | ||
| hour | hour |
Sunday and other Public Holidays
| First buses | 7 to 9am | 9 to 10am | 10am to 5pm | 5 to 7pm | 7 to 8pm | 8 to 11pm | Last buses |
|---|---|---|---|---|---|---|---|
| 0602 | At these 02 | 0903 | At these 26 | At these 23 | 1920 | At these 12 | 2311 |
| 0632 | minutes 32 | 0933 | minutes 56 | minutes 53 | 1946 | minutes 41 | 2341 |
| past the | 0957 | past the | past the | past the | |||
| hour | hour | hour | hour |
Due to the closure of Thornbury Road, buses are diverted from Amhurst Gardens
via London Road to Spring Grove. Passengers for Wood Lane, Jersey Road and
Osterley Library should use shuttle bus S28 from this stop.
17.01.15 6461
Operated by Abellio London for London Buses
tfl.gov.uk 0343 222 1234 TRANSPORT FOR LONDON
Generated by Evidano’s advanced model; not yet checked against a published edition.
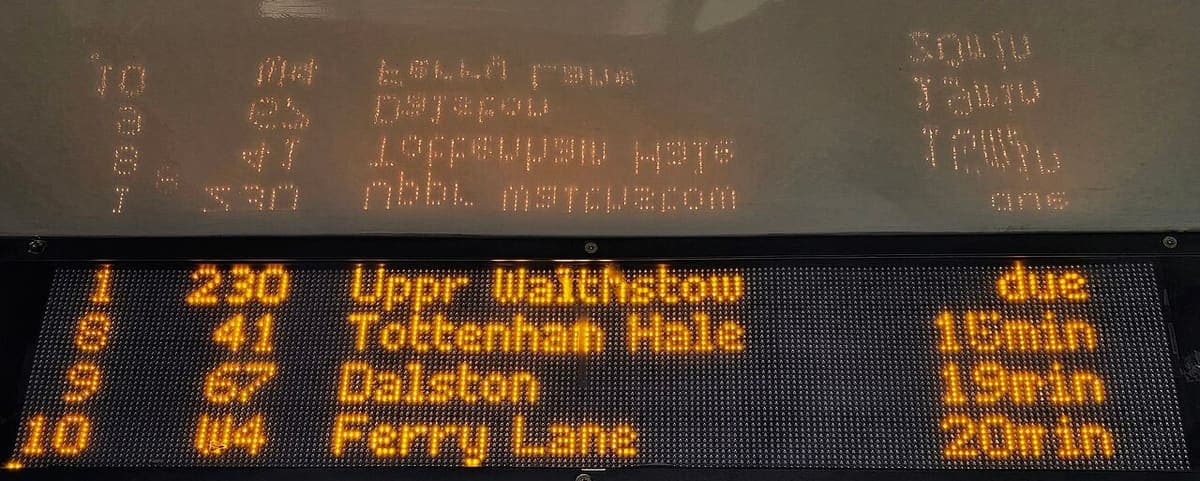
Source · CC BY-SA 4.0 · Photograph by Wikimedia Commons user Acabashi
Evidano Transcription
| 1 | 230 | Uppr Walthmstow | due |
| 8 | 41 | Tottenham Hale | 15min |
| 9 | 67 | Dalston | 19min |
| 10 | W4 | Ferry Lane | 20min |
Generated by Evidano’s advanced model; not yet checked against a published edition.
The shapes that tabular material takes
Tables reach us as printed statistical returns, timetables on a shelter panel or a departure screen, price lists and nutrition panels, scored forms and checklists, mark sheets, ledgers, laboratory results and spreadsheets printed to paper. Their skeleton is the same: one or more header rows, a stub column on the left that names each row, and a body of values. Beyond that they differ wildly. Nineteenth-century statistical tables are set in tiny figures with rules only between the columns; a bus timetable groups its columns into bands of the day; a scoring form runs two independent tables side by side on one sheet.
Several conventions do a lot of quiet work. A heading may span several columns and be subdivided beneath, so a value belongs to a pair of headers rather than one. A stub entry may span several rows, with the rows beneath it indented instead of repeated. Blank cells and rows of dots may mean nothing was recorded, none, or the same as above, and older tables use ditto marks for the last of these. Footnote markers — an asterisk, a dagger, a superscript letter — attach a condition to a single cell, and the note itself sits at the foot in smaller type. Totals are marked by a rule rather than by a word.
Then there is the state of the copy. Rules fade or vanish entirely, so the only thing holding a column together is alignment. Wide tables are printed sideways and have to be turned to be read. Long tables break across pages, and the header is repeated — or not — at the top of the continuation. Photographs of timetables behind glass come with the sky reflected across the middle band, and a dot-matrix departure screen photographed from below is reflected again in the roof of the shelter, so the same words appear twice, once backwards.
Why ordinary OCR struggles here
Columns without lines
When the rules are faint or were never printed, the grid exists only as alignment and white space. A recogniser reading line by line produces a run of numbers with no idea which column each belongs to, and a single value nudged sideways silently changes every figure after it.
Merged cells and stacked headers
A heading spanning six rows, or a two-level header where a country name sits above a repeated unit label, cannot be expressed as one row of names. Flattened, the table loses the connection between a value and the pair of headings that defines it.
Blank cells, dots and ditto marks
A blank, a row of dots and a ditto each mean something different, and none of them means zero. Filling them in from the line above, or dropping them so the row shortens, corrupts the record in a way that is very hard to spot once the numbers are in a spreadsheet.
Figures that must be exact
Long numbers with thousands separators, ranges, times such as 0555 and 2325, and money in three columns leave no room for a plausible guess. A digit misread in the middle of a figure produces a value that still looks like a number, which is why totals and check sums are worth recomputing after transcription.
Who works with this material
Analysts rescuing data from print
Historical statistics, annual reports and scanned returns hold numbers that exist nowhere else in machine-readable form. Getting them into rows and columns, with the blanks preserved, is the difference between a dataset and a picture of one.
Finance and operations teams
Invoices, statements, price lists and stock reports arrive as PDFs and photographs. What is wanted is line items with their quantities and amounts in the right fields, and totals that can be checked against the sum of the rows.
Laboratories and clinical services
Results printed by an instrument, or faxed between departments, come as narrow tables with units, reference ranges and flags. Each of those belongs to its own field, and a value separated from its unit is a hazard rather than a record.
Transport and public information teams
Timetables, fare tables and service notices have to be republished in accessible formats. Reading an existing panel into structured data is usually the quickest route to a version that a screen reader or a journey planner can use.
Getting the best transcription
Say what shape you want back
Ask for CSV, tab-separated rows, Markdown or JSON, and name a marker for an empty cell so that a blank is distinguishable from a value that was not read. Deciding this first saves reformatting every table in the batch afterwards.
Explain the header structure
Tell the model how many header rows there are, whether any heading spans several columns, and whether a stub entry governs the rows beneath it. If the table continues on the next page, say whether the header is repeated there.
Photograph the whole grid, square on
Include every rule and both outer columns in one frame, hold the camera parallel to the page, and turn a sideways table upright before sending it. For a panel behind glass, step to one side so the reflection falls outside the table rather than across the middle of it.
Check the arithmetic afterwards
Add the columns and compare the result with the printed totals, or compare row counts with what you expect. This is the fastest way to find a digit misread or a row that has slipped a column, and it takes seconds in a spreadsheet.
Frequently asked questions
- What format can the table come back in?
- CSV, tab-separated text, Markdown or JSON, whichever suits what happens next. JSON is the most faithful for a table with merged cells or several header levels, because those relationships can be expressed explicitly rather than implied by position.
- How are merged cells handled?
- A heading that spans several columns, or a stub that governs several rows, can either be repeated in every cell it covers or recorded once with its span noted. Say which you want: repetition is easier for a spreadsheet, spans are truer to the original.
- Are empty cells preserved?
- Yes, and they are kept distinct from cells whose content could not be read. Nothing is carried down from the row above unless the table itself uses a ditto mark, in which case the mark can be kept as it stands or expanded on request.
- What happens when the ruled lines have faded away?
- Cell membership is inferred from alignment and spacing, which is how a human reads such a table. Where two readings of a column boundary are equally possible, the ambiguity is reported rather than resolved silently.
- Can a table that runs over several pages be joined up?
- Send the pages together and say that they are one table. Repeated headers on continuation pages can be dropped, and a row split across a page break can be rejoined, so long as the pages arrive in order.
- Are footnote markers kept with the cell they belong to?
- They are. An asterisk, dagger or superscript letter stays attached to its value, and the note itself is returned separately, so the qualification is not lost and does not end up looking like part of the number.
Related scripts and pages
Get your tables out as data
Upload a statistical table, a timetable, a scored form or a printed report, choose Tables and Structured Content, and name the output format you want.